Alveo Climate: Inline Climate Sensing for Lung Simulators
Compact sensing module that measures temperature and relative humidity directly inside the airway path of a lung-simulator. Sensirion SHT85 + Arduino Nano + a standalone Windows logging app. Built for respiratory researchers who need true in-flow data, not ambient.
Overview
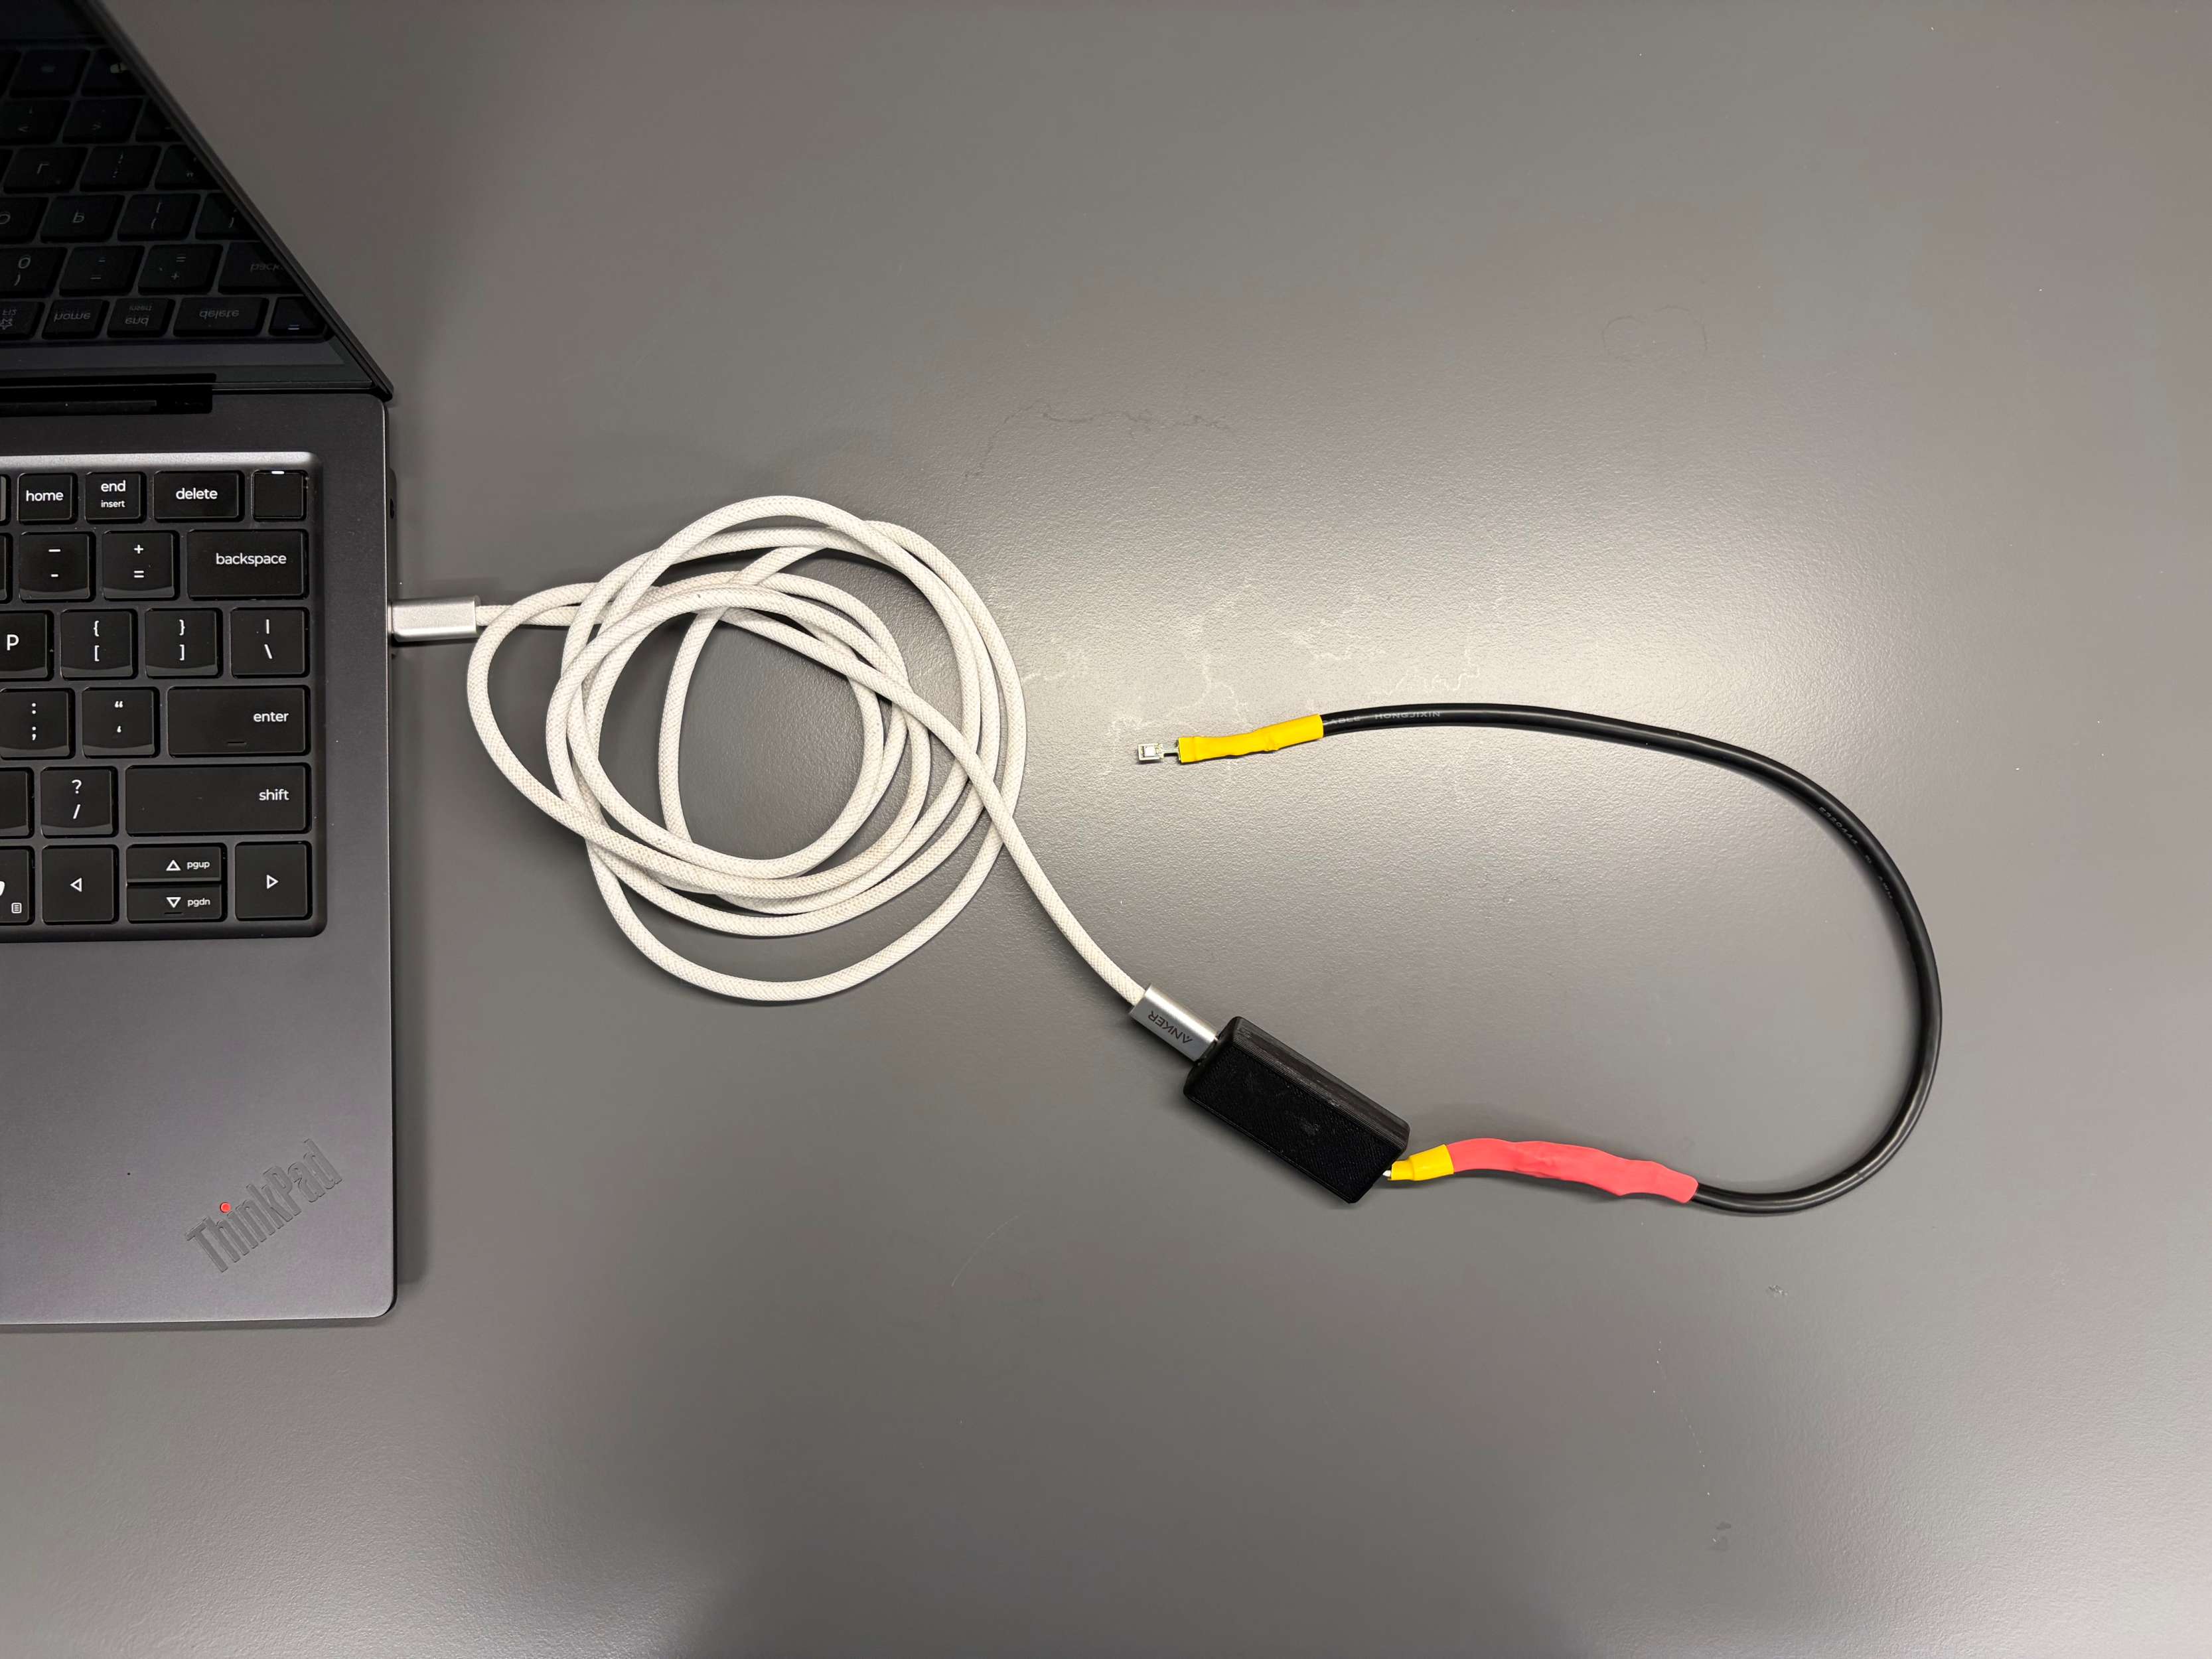
Alveo Climate is a compact sensing module that measures temperature and relative humidity directly inside the small-bore tubing of a lung-simulator platform. It pairs a high-accuracy Sensirion SHT85 sensor with an Arduino Nano controller and a purpose-built Windows logging application, giving researchers a continuous, timestamped record of the conditions inside the airway path.
Because the sensor sits in the flow path itself, Alveo Climate reports the true climate at the point of measurement, the information that respiratory-mechanics work and biomarker studies actually need. Setup is straightforward: connect the module over USB, open the application, and begin logging.
Why I built it
Respiratory science labs routinely run experiments on lung simulators and aerosol delivery systems where what matters isn’t the air in the room, but the air inside the tubing, at the exact spot where the breath, the drug, or the biomarker exists. Off-the-shelf temperature and humidity sensors give you ambient readings, and ambient readings miss the climate that a simulated airway is actually experiencing.
Talking to researchers in respiratory mechanics and biomarker studies, I kept hearing the same gap: they wanted true in-flow data, but the available tooling forced them to make do with proxies. Alveo Climate exists to close that gap. Put the sensor in the flow path, plug into a laptop, click Start, and walk away with the data the experiment needed.
What researchers get
- Inline measurement where it matters. The sensor sits directly in the airway flow path, so readings reflect the true conditions inside the tubing rather than ambient room values.
- Lab-grade accuracy. Built on the Sensirion SHT85: ±1.5 %RH and ±0.1 °C typical accuracy, factory-calibrated, with the long-term stability respiratory work requires.
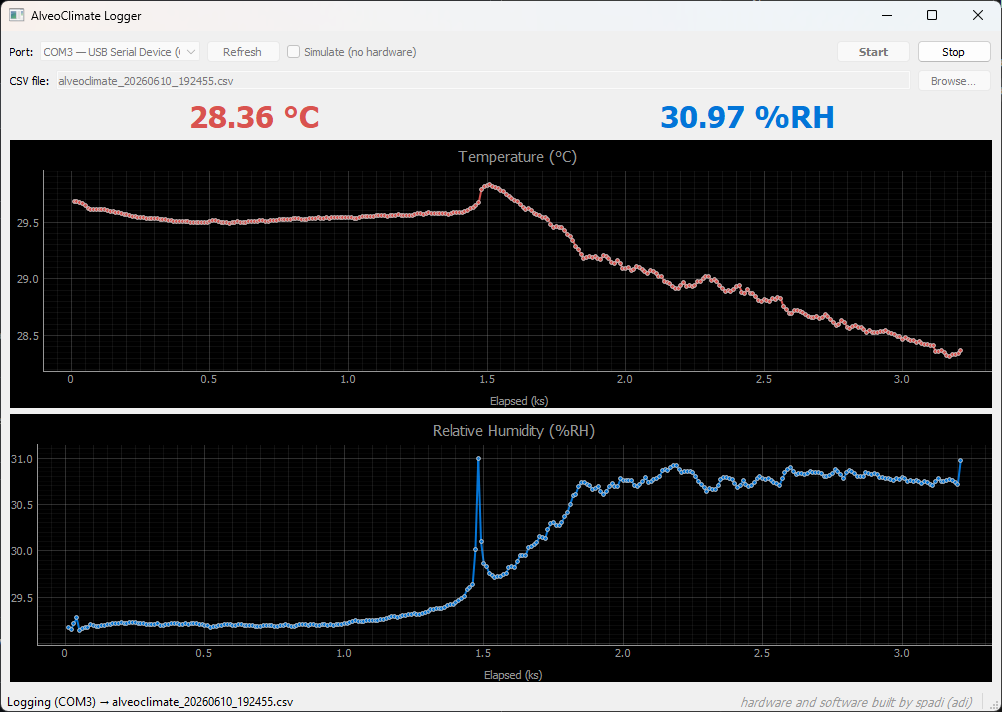
- Live, auto-scaling graphs. The Windows app plots temperature and humidity in real time, rescaling the axes automatically as data evolves.
- One-click logging to CSV. Start and Stop buttons control recording; every reading is written to a timestamped CSV at a location you choose.
- Smoothed, reliable data. Samples at roughly 10 Hz and averages over a configurable window (10 seconds by default). Every sample is CRC-checked on the I²C bus, so corrupted reads are dropped instead of recorded.
- No installation required. The application runs as a single Windows executable on any modern machine. No Python, no drivers, no IT ticket.
- Built-in demo mode. A simulate mode lets researchers explore the interface and train new users with no hardware connected.
The hardware
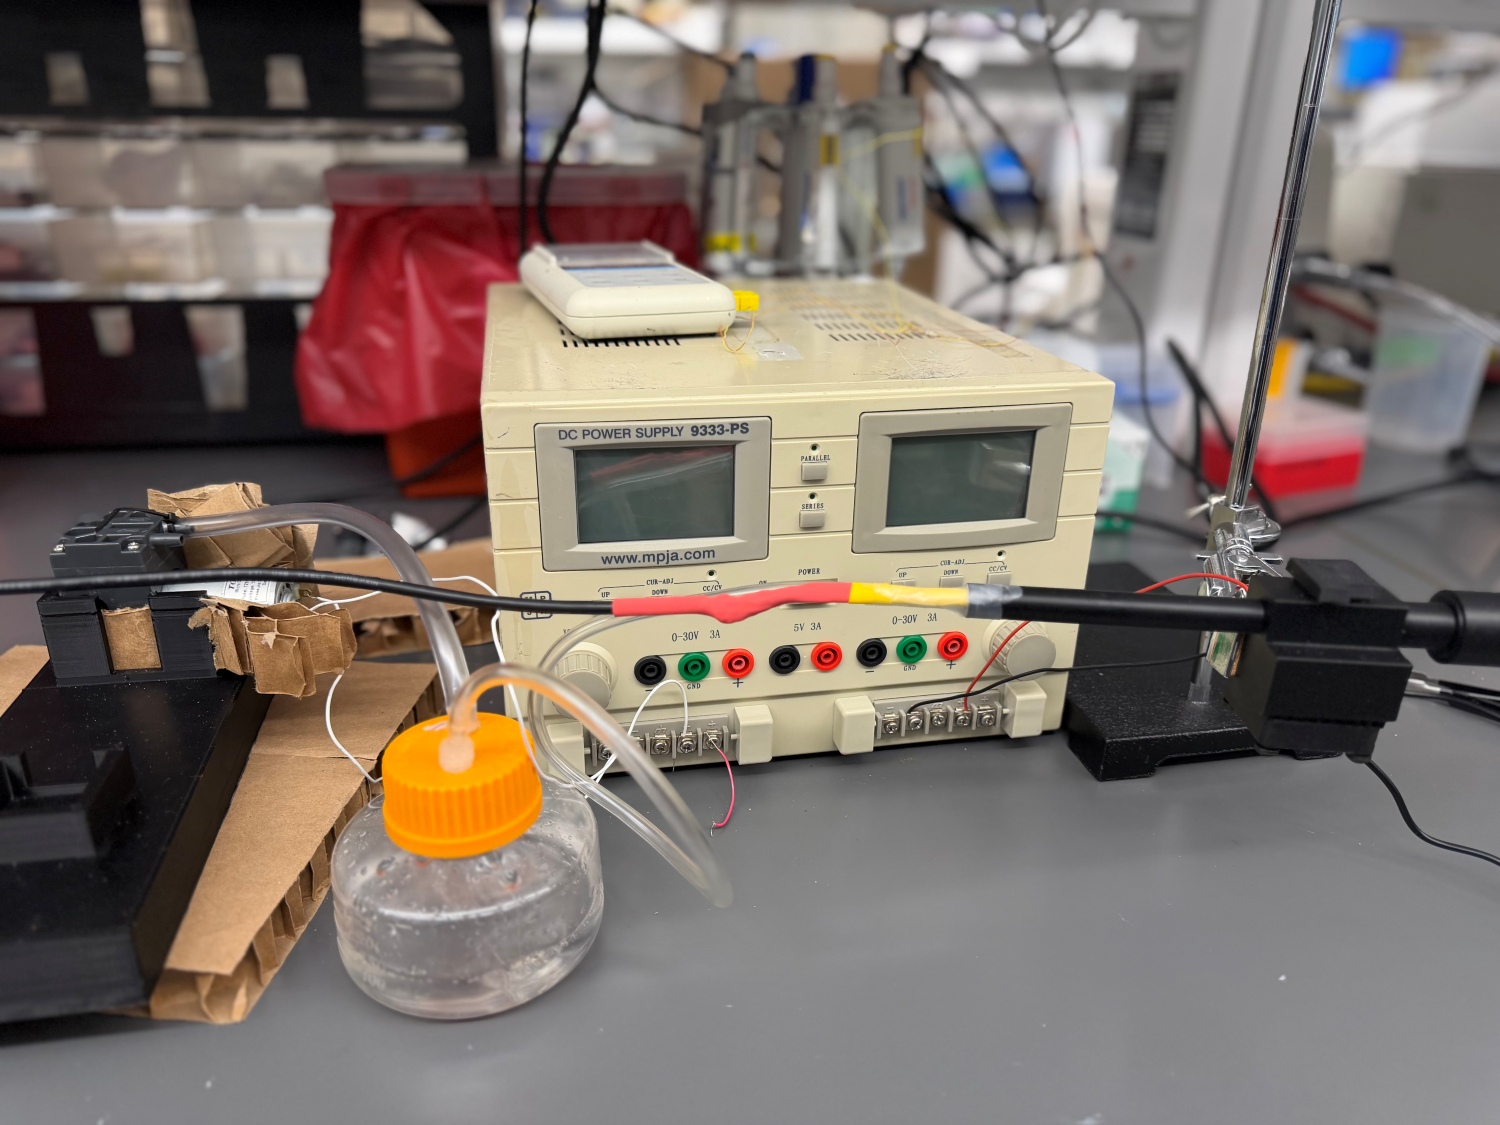
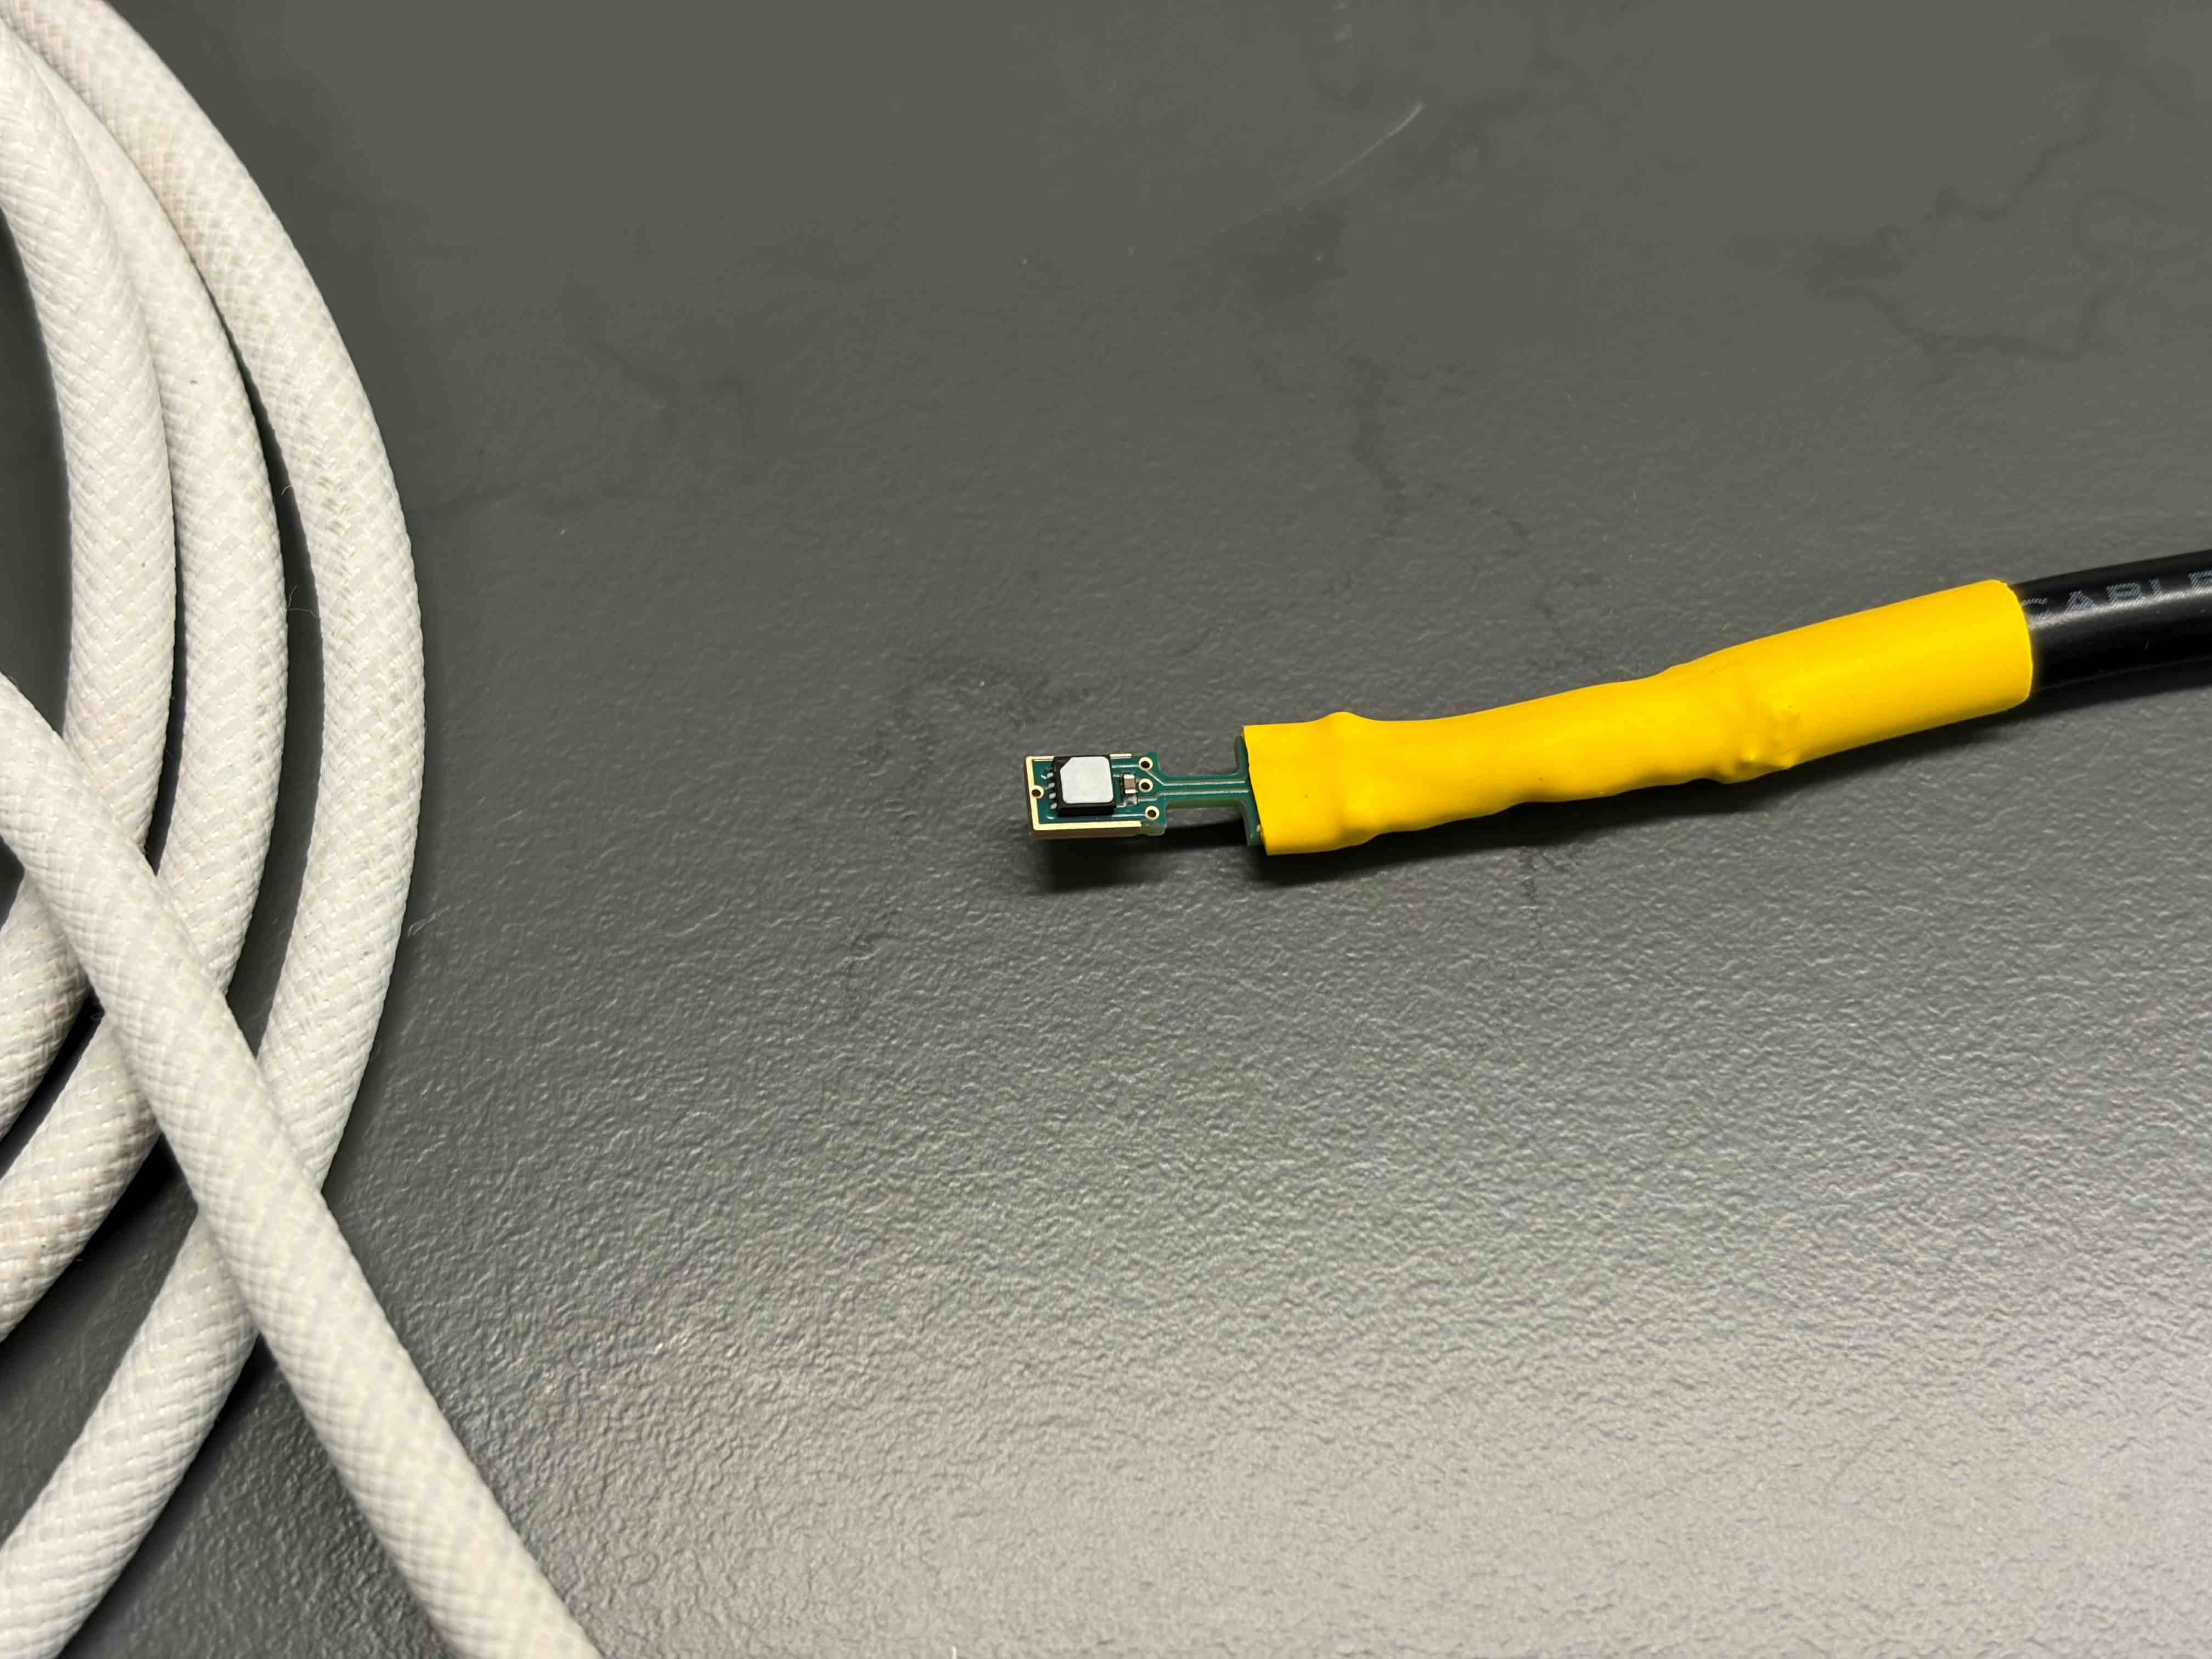
The module is purpose-built for inline mounting in standard small-bore respiratory tubing (around 10 mm inner diameter). The SHT85 sits exposed to the flow, the Arduino Nano handles I²C transactions and timing, and a single USB cable carries both power and data back to the host laptop.
The interface
The host software is a single-executable Windows app. Researchers see live, auto-scaling temperature and humidity plots side by side, with quick controls for averaging window, CSV output location, and a Start/Stop logging button. A demo mode lets a lab manager train new users without needing the hardware on the bench.
Specifications
Sensor performance figures are drawn from the Sensirion SHT85 datasheet. Response times (τ63) describe the time to reach 63% of a step change and represent the physical limit of the sensor itself.
| Specification | Detail |
|---|---|
| Measured parameters | Relative humidity and temperature |
| Sensor | Sensirion SHT85 (factory-calibrated, pin-type) |
| Humidity accuracy | ±1.5 %RH (typical) |
| Humidity range | 0 to 100 %RH |
| Humidity response time (τ63) | 8 s |
| Temperature accuracy | ±0.1 °C (typical) |
| Temperature range | -40 to 105 °C |
| Temperature response time (τ63) | greater than 2 s |
| Sampling rate | ~10 Hz, averaged on-board |
| Output cadence | One averaged reading every 10 s (configurable) |
| Sensor interface | I²C (address 0x44) |
| Host connection | USB, via Arduino Nano controller |
| Data output | Timestamped CSV |
| Tubing compatibility | Inline mounting in ~10 mm bore |
| Host software | Windows application (standalone, no installation) |
For the community
If you run a respiratory lab and this looks useful, reach out. The module is small, the software is portable, and the data format is boring on purpose so it plugs into whatever pipeline you already have. The right tool finds the right researcher, eventually.